InSights Reporting Dashboards
![]()
INTOUCH HELP HOME > INTOUCH INSIGHTS > DASHBOARDS
Toolbar Icons and Options
On the top of each dashboard is a toolbar. Here's a summary of each option
- Filters: Select the funnel icon to bring up your filtering options. For example, if you want to look at just your membership data, select Product, check the Membership box, and then select Apply in the bottom right. If you bring up the filter options and don't need to make any changes, simply click the filter icon again to hide it.
- Download / Export: Select the download button to download a report. File options may vary by report, but typically include pdf and excel file options.
- Refresh: This icon resets your data.
- Dashboards / Folder: The folder icon in the top right will give you full list of dashboards for easy navigation.
Dashboards
Club Dashboards
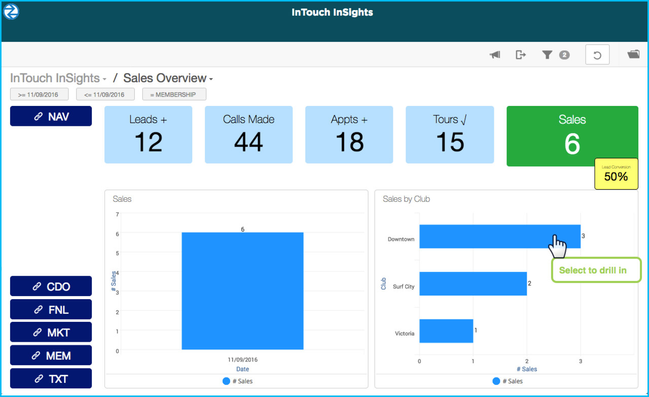
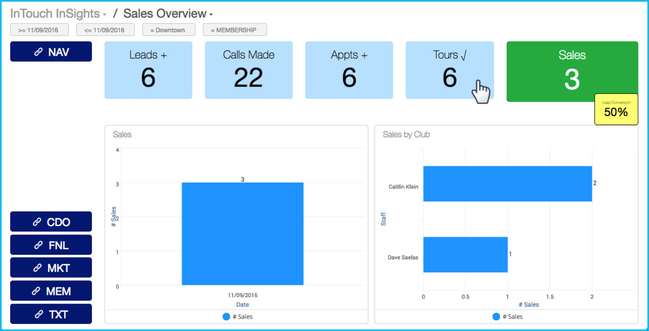
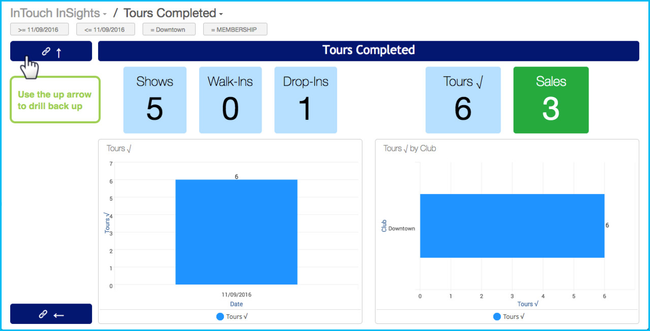
Sales Overview (SO)
The first dashboard in InSights is the Sales Overview (SO) for today. This gives you your most important KPIs at a glance for both membership and PT. To drill in, just click a KPI. To go back up, click the up arrow. See below sections how to filter your dashboards to view just membership, just PT, specific dates, clubs, contact methods, etc.
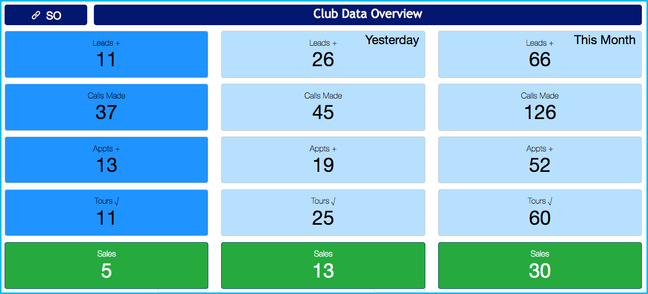
Club Data Overview (CDO)
This gives you your most important KPIs at a glance for today, yesterday, and month to date for both membership and PT.
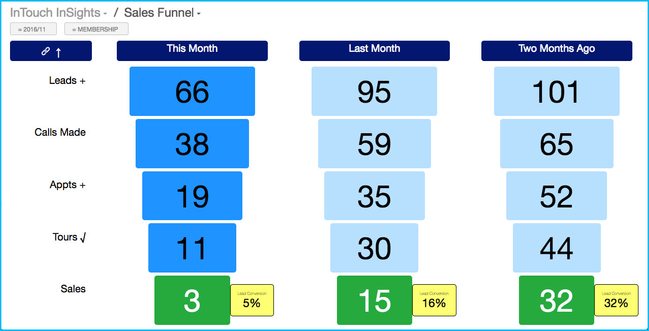
Sales Funnel (FNL)
This dashboard lets you see club performance at a glance. The benefit of the funnel is that let's you see where you need to focus efforts because each step of the funnel is specific to the leads added in top. How many of your leads make through the entire sales process? In the image below, 66 membership leads have been added this month, and of those 66, 3 have had a call made, appointment added, tour completed and sold. 5% of the 66 leads added made it through each step of the sales process.
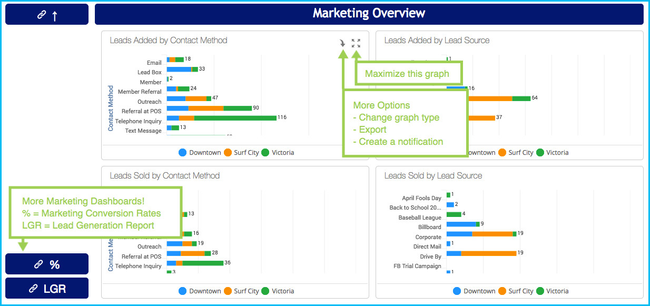
Marketing (MKT)
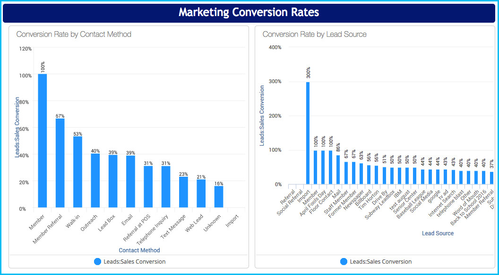
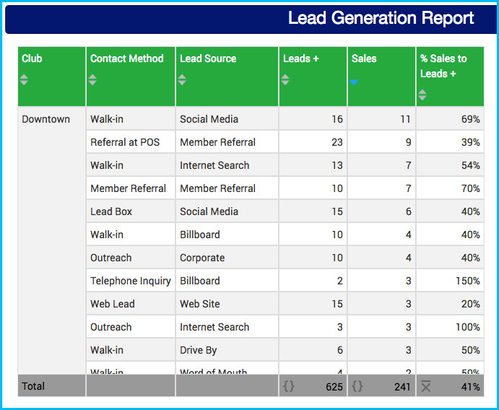
The marketing dashboard lets you drill down into your Lead Sources and Contact Methods. See where your lead traffic is coming from, where your sales are coming from, and then compare the two using the Marketing Conversion Rates (%). You can even switch back and forth between bar graphs, line graphs, pie charts, tables and more to quickly and easily analyze your marketing efforts.
Marketing Conversion Rates (%)
Lead Generation Report (LGR)
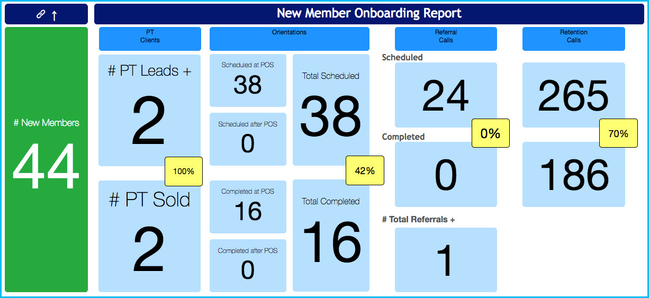
New Member Onboarding (MEM)
Getting your new members engaged and active within the first 90 days (and especially the first 30!) can be a critical factor in the long term retention of that member. This dashboard let's you view that new member onboarding process at a glance. How many new members do you have? How many have booked an Orientation? How many completed that Orientation? Were they created as PT lead for trainer follow-up? And how about your new member follow-up? Is your staff calling those new members to get referrals or to see how things are going? One quick glance can answer all of these questions and more.
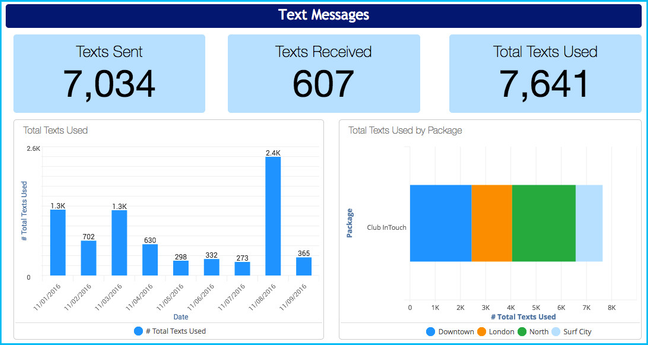
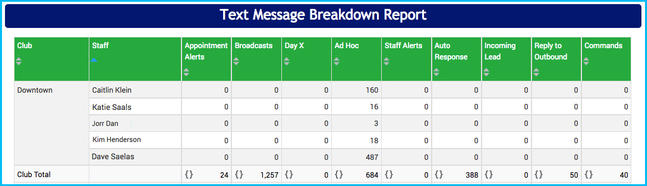
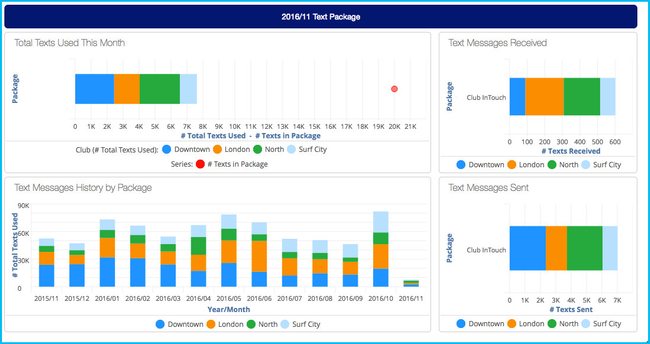
Text Messages (TXT)
This dashboard starts by showing your overall text usage and even compares it to your current text package. Drilling down into Texts Sent, Texts Received or overall Texts Used will break your report down by staff. Certain text messages will stay under the Club Total (such as Appointment Reminders and Broadcasts), but items such Adhoc will be listed under individual staff.
Package
This dashboard shows your package and usage as well as a month to month comparison. Dashboards will vary based on whether your clubs have an individual text package or whether they share a package across your organization.
Individual Dashboards
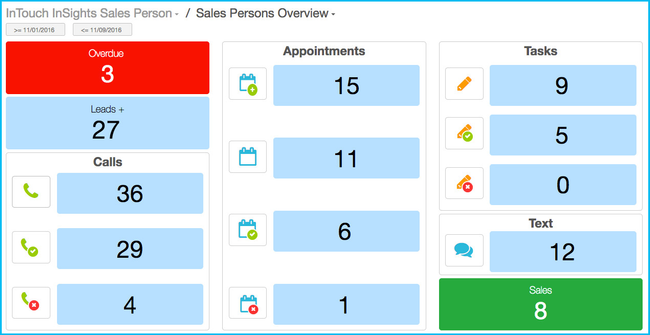
Sales Person Overview
Individual dashboards are designed for your sales staff, PT staff or anyone that needs access to only his or her own personal InSights KPIs. Individual dashboards are disabled by default since not all clubs want every staff to have dashboard access and so we've put this ability in your complete control.